
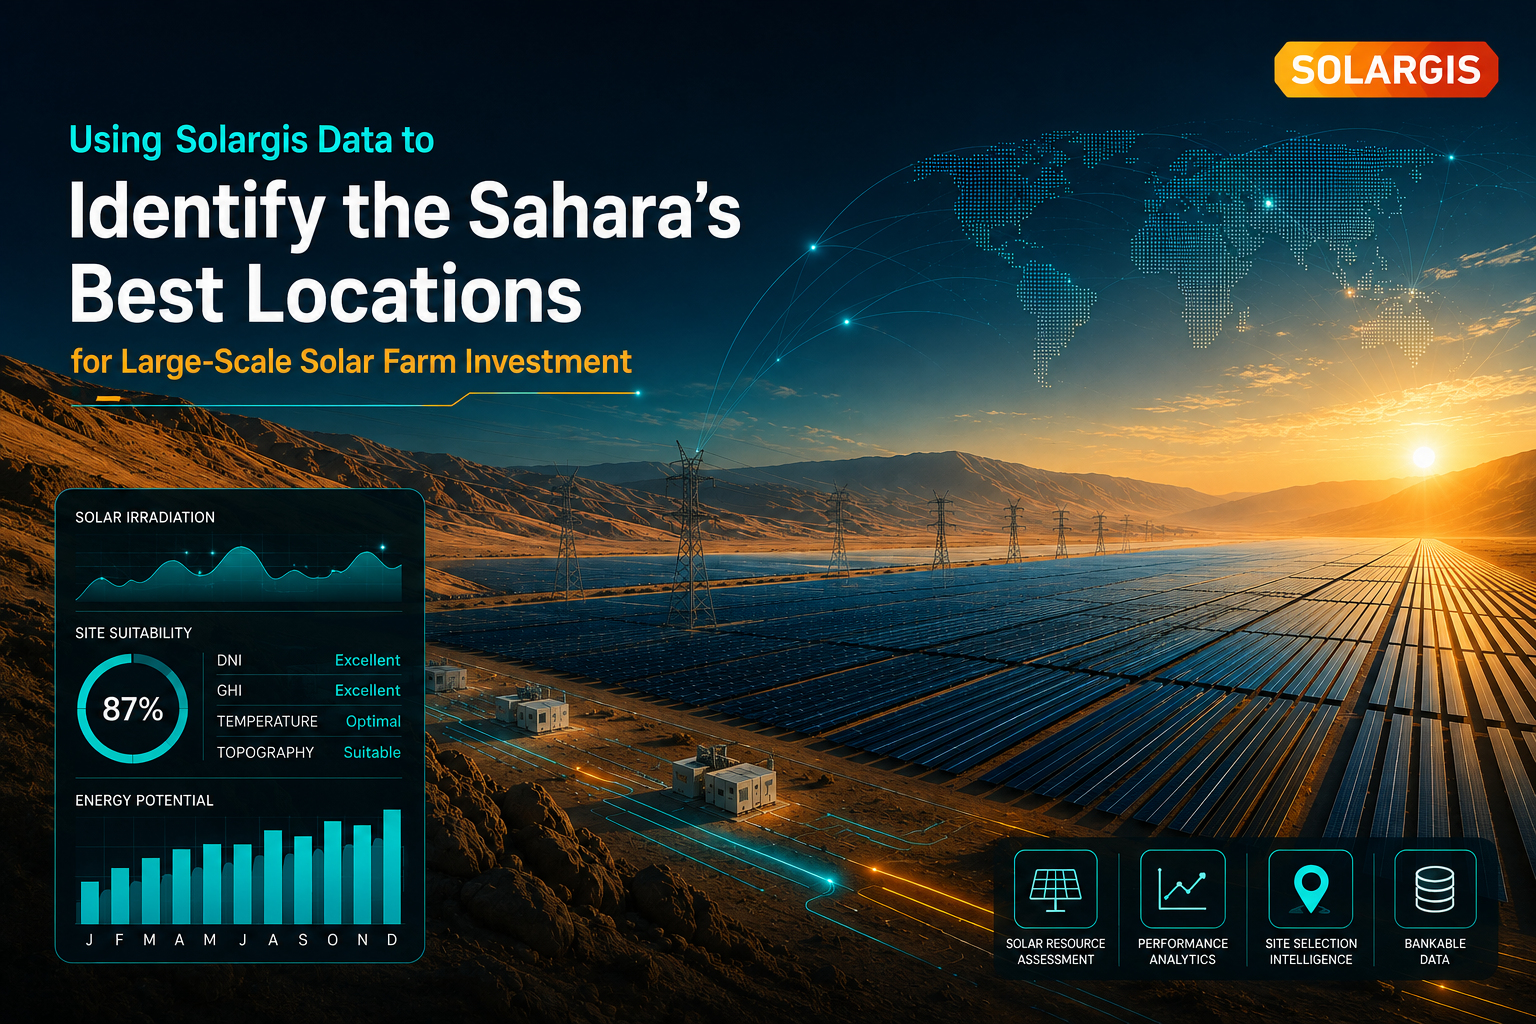
Sahara Solar Potential: Best Regions for Utility-Scale Solar Farms
Finding the right location for a large-scale solar investment begins with one fundamental question: where can solar panels generate the most electricity over the long term? Around the world, this search naturally leads investors toward regions with exceptionally strong solar irradiation, low cloud cover, suitable terrain, and large areas of available land.
Chile’s Atacama Desert is widely regarded as a solar power powerhouse—and for good reason. Thanks to its exceptionally dry climate, high-altitude areas, and consistently clear skies, the Atacama receives some of the highest solar radiation levels recorded anywhere in the world.
But Atacama is not the only desert with enormous solar potential.
When people think of the Sahara, they usually picture an endless sea of sand, but it's really one of the world's absolute best hotspots for clean energy. Covering roughly 9.2 million square kilometers, it's about the size of Europe and easily bigger than the continental US. This massive region spans right across North Africa, covering broad swaths of Algeria, Libya, Egypt, Mauritania, Mali, Niger, Morocco, and Western Sahara, plus parts of Sudan and Tunisia.
Its sheer size, dry climate, low population density, and wide open spaces make large swaths of the Sahara uniquely suited for massive solar projects. That said, you can’t just drop a solar farm anywhere in the desert. Reality quickly comes into play with factors like land rights, environmental rules, access to water, power grid connections, transport links, local security, and sheer setup costs. Still, given the sheer volume of land that could be tapped, the Sahara is simply too big to overlook in any serious conversation about the future of green energy.
This potential has attracted ambitious ideas for decades.
One of the most famous examples was the DESERTEC concept, which proposed using the enormous renewable-energy resources of North Africa to supply electricity to the region and potentially export significant amounts of power to Europe. The concept emerged from cooperation among scientists and institutions around the Mediterranean, while the private DESERTEC Industrial Initiative (Dii) was established in 2009 to pursue the vision commercially. The initiative attracted major European and North African companies and institutions, while the German government publicly supported the broader idea of an interconnected renewable-energy system linking Europe and North Africa.
However, the original commercial vision faced significant economic, financing, and regulatory challenges. Nevertheless, the broader DESERTEC concept did not disappear and continues to influence discussions about desert renewable energy, hydrogen, electricity interconnections, and North African–European energy cooperation.
How We Identified the Best Solar Farm Locations in the Sahara
Our objective in this analysis is much more specific.
Rather than asking whether the Sahara as a whole has enough solar energy to support large-scale development, we want to identify which individual locations within the Sahara offer the strongest technical conditions for solar-farm investment.
To do this, we selected representative locations across several Saharan regions and evaluated them using data from the Global Solar Atlas, developed from Solargis solar-resource and photovoltaic-potential datasets. The platform provides standardized information on solar irradiation, photovoltaic output potential, terrain, temperature, and other environmental parameters, allowing different locations to be compared using the same methodology.
One of the most important indicators in our screening is PVOUT.
PVOUT represents the expected long-term electricity generation from a photovoltaic system relative to its installed capacity. It is expressed in kWh/kWp, meaning the amount of electricity that a PV system with 1 kWp of installed capacity is expected to generate over a year. Unlike a simple measurement of sunlight alone, PVOUT incorporates factors affecting practical PV generation, including solar resource, temperature, system configuration, shading, soiling, and certain terrain and land-use considerations.
In other words, a location with a higher PVOUT generally has a stronger technical potential for producing electricity from photovoltaic systems than a location with a lower PVOUT, assuming comparable project conditions.
However, PVOUT alone does not determine whether a project will be profitable.
A location may have exceptional solar potential but still be difficult or expensive to develop if it is hundreds of kilometers from a suitable transmission line, far from reliable roads, or extremely difficult to access. This is why our analysis is divided into two stages.
Solar Resource Assessment Using Solargis Data
First, we screen the selected locations using the solar and physical indicators provided by the Global Solar Atlas. These include:
- PVOUT
- GHI
- DNI
- GTI at the optimum tilt
- Average temperature
- Terrain slope
- Land cover
- Population density
- Other relevant climatic and geographical indicators
The strongest locations from this first stage will then be selected for a more detailed comparison.
Infrastructure, Grid Access & Logistics for Sahara Solar Projects
After identifying the leading technical candidates, we introduce three additional indicators that are particularly important for a real-world utility-scale project.
First: distance to the high-voltage electricity grid. A solar farm needs a practical route for connecting its generation to the electricity system. A location close to suitable high-voltage infrastructure can potentially reduce the distance and complexity of the connection and make it easier to export surplus electricity. Grid access can also become important when electricity is intended for energy-intensive projects located near the solar farm, such as data centers, industrial facilities, or other large electricity consumers.
Second: road accessibility. Large solar projects require the transportation of thousands of components and continuous access for construction, maintenance, replacement parts, heavy equipment, and personnel. A site with good access to major roads can therefore have a significant logistical advantage over an equally sunny location that is isolated by hundreds of kilometers of difficult terrain.
Third: distance to an airport. The Sahara's enormous geographic scale makes personnel logistics particularly important. An airport within reasonable reach can facilitate the movement of engineers, technical specialists, project managers, contractors, and other personnel during construction and long-term operation.
This second stage is therefore designed to answer a more practical question:
Is the sunniest location also a realistic location for building and operating a large-scale solar farm?
That distinction is crucial.
The purpose of this study is not simply to find the place where the Sun shines most strongly. It is to identify locations where excellent solar resources can potentially be combined with terrain suitability, land availability, electricity infrastructure, transportation access, and logistical practicality.
The Sahara offers an extraordinary natural resource. The challenge is determining where that resource can be transformed into economically meaningful electricity generation.
Our analysis therefore begins with the solar map — and ends with the infrastructure required to turn sunlight into a viable energy project.
Stage One: Technical Solar Assessment of Selected Sahara Regions
Technical Scoring Methodology: How the Five-Star Rating Works
To compare the selected Sahara locations consistently, we convert the technical indicators provided by Solargis and the Global Solar Atlas into a five-star scoring system. The purpose is not to suggest that every indicator has the same importance, but rather to create a clear and transparent framework for comparing the overall technical suitability of each site.
PVOUT: The Primary Solar-Generation Indicator
PVOUT is one of the most important indicators in our assessment because it estimates the long-term electricity generation potential of a photovoltaic system at a given location. For this reason, we give PVOUT a particularly important role in the technical screening.
For the Sahara analysis, a PVOUT value of 2,100 kWh/kWp or higher receives 5 stars. Locations between 2,000 and 2,099.9 kWh/kWp receive 4 stars, those between 1,950 and 1,999.9 receive 3 stars, locations between 1,900 and 1,949.9 receive 2 stars, and values below 1,900 kWh/kWp receive 1 star.
This threshold system is designed specifically for our comparison of Saharan locations. It allows us to distinguish between sites with exceptionally high photovoltaic output and those with progressively lower generation potential.
Why Does Temperature Matter?
Temperature is another important consideration because photovoltaic modules do not generally perform at their rated power under high operating temperatures. As module temperature increases, electrical efficiency typically decreases, which can reduce energy production.
Temperature also matters from a long-term operational perspective. A solar module installed in a very hot environment is exposed to greater thermal stress over many years. Repeated heating and cooling cycles can contribute to material stress and degradation.
For this reason, moderate average temperatures receive a higher score than extremely hot conditions in our assessment. The objective is not to identify the coldest location, but to favor locations where strong solar resources are combined with a more favorable thermal environment for photovoltaic operation and long-term durability.
Why Does Slope Matter?
Terrain slope directly affects the practicality and cost of developing a large-scale solar farm.
Large utility-scale photovoltaic projects generally benefit from relatively flat or gently sloping terrain. A flatter site can reduce the amount of earthmoving, grading, excavation, and structural adaptation required before construction. It can also simplify the installation of mounting structures, internal roads, drainage systems, electrical infrastructure, and maintenance access.
Therefore, locations with very low slopes receive higher scores, while steeper terrain receives progressively lower scores. This does not mean that a sloped site cannot support a solar farm; rather, it recognizes that increasing terrain complexity can introduce additional engineering and construction requirements.
Land Cover and Available Space
Land cover is also considered because a large-scale solar project requires substantial contiguous land. Areas classified as bare land or undeveloped desert terrain can be technically advantageous when they do not conflict with agricultural activities, dense settlements, protected areas, or other major land uses.
A favorable land-cover classification therefore receives a higher score, while land uses that may create greater development constraints receive lower scores.
Population Density
Population density is included as an initial land-use screening indicator. Areas with very low population density may offer greater flexibility for large-scale projects and fewer potential conflicts with residential development.
However, a low population density score should not be interpreted as proof that land is legally available for development. Land ownership, environmental regulations, protected areas, indigenous or local community rights, and national permitting requirements must be investigated separately during a real project feasibility study.
GHI, DNI and GTI
We also evaluate GHI (Global Horizontal Irradiation), DNI (Direct Normal Irradiation), and GTI at the optimum tilt because they provide complementary information about the solar resource.
Higher GHI generally indicates a stronger overall solar resource on a horizontal surface. DNI is particularly important for understanding the direct component of solar radiation and is especially relevant to technologies that rely heavily on direct sunlight. GTI at the optimum tilt provides an indication of the solar irradiation available to a tilted photovoltaic surface under the modeled optimum orientation.
These indicators therefore help us determine whether a location's strong PVOUT is supported by a broader and consistent solar resource.
How Are the Stars Assigned?
The five-star system follows a simple principle:
★★★★★ — Excellent: The location performs exceptionally well for the indicator and falls within the highest-value range.
★★★★ — Very Good: The location has a strong value but does not reach the highest threshold.
★★★ — Good: The indicator remains favorable but is noticeably below the leading locations.
★★ — Moderate: The value presents a meaningful technical disadvantage compared with stronger sites.
★ — Weak: The indicator represents a relatively significant limitation for large-scale solar development.
Instead, each indicator receives its own scientifically and practically justified scoring ranges, based on how that parameter affects photovoltaic generation, construction, operation, or long-term project suitability.
From Individual Indicators to a Site Ranking
After assigning stars to the relevant indicators, we combine the results to establish an initial technical ranking. This first ranking answers a specific question:
Which locations offer the strongest technical conditions for large-scale photovoltaic development?
Importantly, this is not yet a final investment ranking.
A location can achieve an excellent technical score while remaining difficult or expensive to develop because of its distance from high-voltage transmission infrastructure, poor road access, or limited access to airports and other logistical facilities.
For that reason, the highest-ranked locations from the technical stage will proceed to the second stage of our analysis, where we introduce three additional practical indicators:
- Distance to the high-voltage electricity grid
- Distance to major road infrastructure
- Distance to the nearest suitable airport
This two-stage methodology allows us to distinguish between the best solar resource and the best practical location for a real-world solar investment.
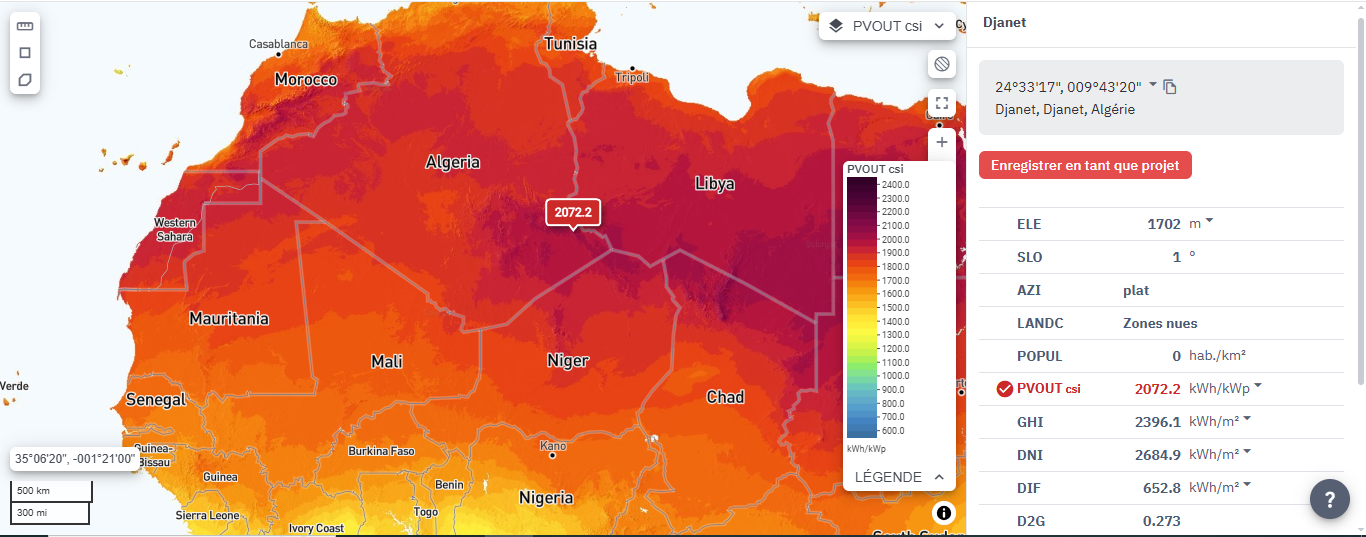
1. Djanet, Algeria
| Indicator | Value | Rating |
|---|---|---|
| Elevation | 1,702 m | — |
| Slope | 1° | ⭐⭐⭐⭐⭐ |
| Land Cover | Bare areas | ⭐⭐⭐⭐⭐ |
| Population Density | 0 hab./km² | ⭐⭐⭐⭐⭐ |
| PVOUT | 2,072.2 kWh/kWp | ⭐⭐⭐⭐ |
| GHI | 2,396.1 kWh/m² | ⭐⭐⭐⭐⭐ |
| DNI | 2,684.9 kWh/m² | ⭐⭐⭐⭐⭐ |
| DIF | 652.8 kWh/m² | — |
| D2G | 0.273 | — |
| GTI (optimal) | 2,642.0 kWh/m² | ⭐⭐⭐⭐⭐ |
| Optimal Tilt | 27° | — |
| Mean Temperature | 19.1°C | ⭐⭐⭐⭐⭐ |
| CDD | 1,434 degree-days | — |
| HDD | 1,002 degree-days | — |
| Technical Score | 33/35 | ⭐⭐⭐⭐⭐ |
| Rank | #1 | 🥇 |
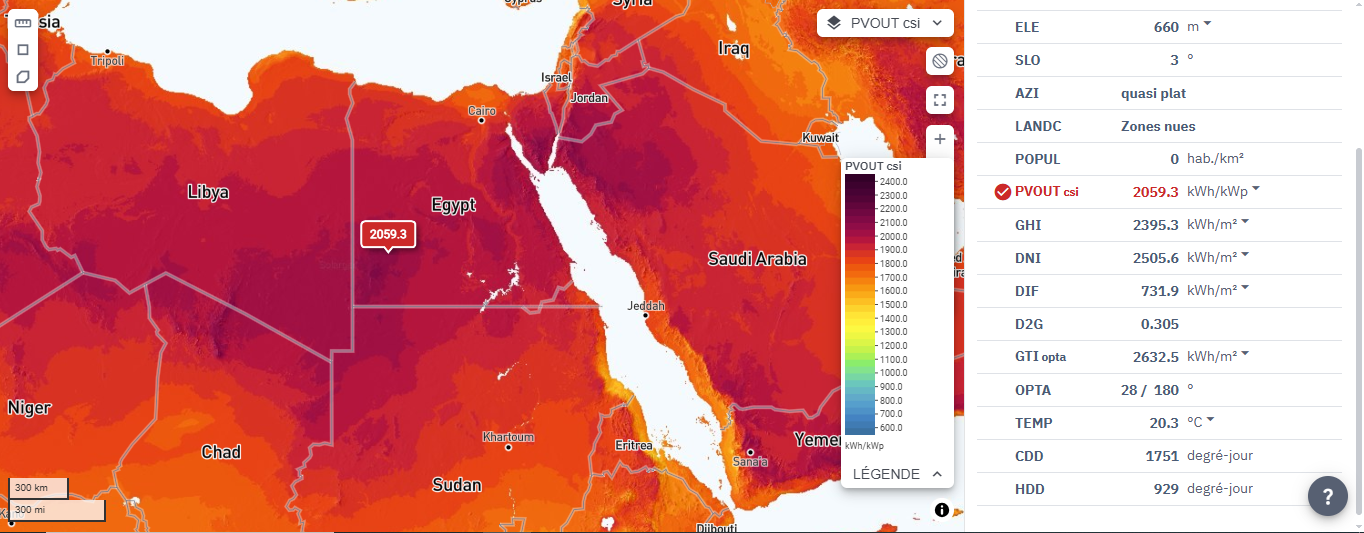
2. New Valley, Egypt
| Indicator | Value | Rating |
|---|---|---|
| Elevation | 660 m | — |
| Slope | 3° | ⭐⭐⭐⭐ |
| Land Cover | Bare areas | ⭐⭐⭐⭐⭐ |
| Population Density | 0 hab./km² | ⭐⭐⭐⭐⭐ |
| PVOUT | 2,059.3 kWh/kWp | ⭐⭐⭐⭐ |
| GHI | 2,395.3 kWh/m² | ⭐⭐⭐⭐⭐ |
| DNI | 2,505.6 kWh/m² | ⭐⭐⭐⭐⭐ |
| DIF | 731.9 kWh/m² | — |
| D2G | 0.305 | — |
| GTI (optimal) | 2,632.5 kWh/m² | ⭐⭐⭐⭐⭐ |
| Optimal Tilt | 28° | — |
| Mean Temperature | 20.3°C | ⭐⭐⭐⭐⭐ |
| CDD | 1,751 degree-days | — |
| HDD | 929 degree-days | — |
| Technical Score | 29/35 | ⭐⭐⭐⭐⭐ |
| Rank | #2 | 🥈 |
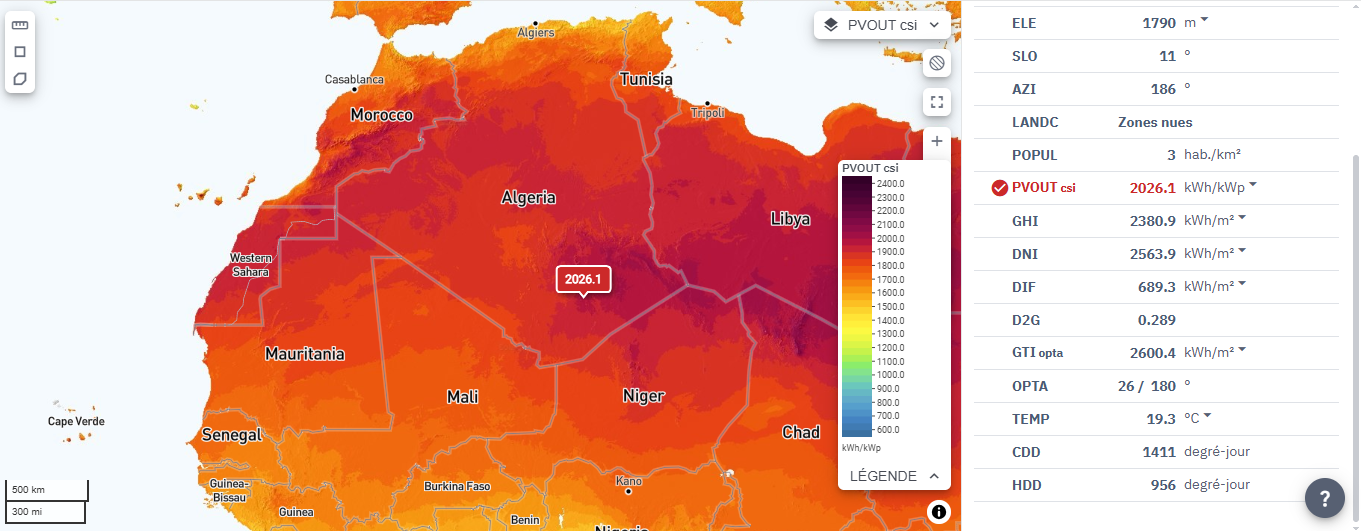
3. Tamanrasset, Algeria
| Indicator | Value | Rating |
|---|---|---|
| Elevation | 1,790 m | — |
| Slope | 11° | ⭐⭐ |
| Land Cover | Bare areas | ⭐⭐⭐⭐⭐ |
| Population Density | 3 hab./km² | ⭐⭐⭐⭐⭐ |
| PVOUT | 2,026.1 kWh/kWp | ⭐⭐⭐⭐ |
| GHI | 2,380.9 kWh/m² | ⭐⭐⭐⭐⭐ |
| DNI | 2,563.9 kWh/m² | ⭐⭐⭐⭐⭐ |
| DIF | 689.3 kWh/m² | — |
| D2G | 0.289 | — |
| GTI (optimal) | 2,600.4 kWh/m² | ⭐⭐⭐⭐⭐ |
| Optimal Tilt | 26° | — |
| Mean Temperature | 19.3°C | ⭐⭐⭐⭐⭐ |
| CDD | 1,411 degree-days | — |
| HDD | 956 degree-days | — |
| Technical Score | 28/35 | ⭐⭐⭐⭐ |
| Rank | #3 | 🥉 |
4. Bordj El Haouas, Algeria
| Indicator | Value | Rating |
|---|---|---|
| Elevation | 1,251 m | — |
| Slope | 1° | ⭐⭐⭐⭐⭐ |
| Land Cover | Bare areas | ⭐⭐⭐⭐⭐ |
| Population Density | 0 hab./km² | ⭐⭐⭐⭐⭐ |
| PVOUT | 2,011.0 kWh/kWp | ⭐⭐⭐⭐ |
| GHI | 2,359.4 kWh/m² | ⭐⭐⭐⭐⭐ |
| DNI | 2,515.1 kWh/m² | ⭐⭐⭐⭐⭐ |
| DIF | 710.0 kWh/m² | — |
| D2G | 0.305 | — |
| GTI (optimal) | 2,602.1 kWh/m² | ⭐⭐⭐⭐⭐ |
| Optimal Tilt | 28° | — |
| Mean Temperature | 22.4°C | ⭐⭐⭐⭐ |
| CDD | 2,259 degree-days | — |
| HDD | 658 degree-days | — |
| Technical Score | 28/35 | ⭐⭐⭐⭐ |
| Rank | #4 | 4️⃣ |
5. South Sinai, Egypt
| Indicator | Value | Rating |
|---|---|---|
| Elevation | 740 m | — |
| Slope | 2° | ⭐⭐⭐⭐⭐ |
| Land Cover | Bare areas | ⭐⭐⭐⭐⭐ |
| Population Density | 3 hab./km² | ⭐⭐⭐⭐⭐ |
| PVOUT | 2,003.3 kWh/kWp | ⭐⭐⭐⭐ |
| GHI | 2,267.7 kWh/m² | ⭐⭐⭐⭐ |
| DNI | 2,641.0 kWh/m² | ⭐⭐⭐⭐⭐ |
| DIF | 585.7 kWh/m² | — |
| D2G | 0.258 | — |
| GTI (optimal) | 2,547.8 kWh/m² | ⭐⭐⭐⭐⭐ |
| Optimal Tilt | 30° | — |
| Mean Temperature | 18.2°C | ⭐⭐⭐⭐⭐ |
| CDD | 1,202 degree-days | — |
| HDD | 1,129 degree-days | — |
| Technical Score | 28/35 | ⭐⭐⭐⭐ |
| Rank | #5 | 5️⃣ |
6. Bettal Ait Ouskad, Morocco
| Indicator | Value | Rating |
|---|---|---|
| Elevation | 1,557 m | — |
| Slope | 1° | ⭐⭐⭐⭐⭐ |
| Land Cover | Bare areas | ⭐⭐⭐⭐⭐ |
| Population Density | 11 hab./km² | ⭐⭐⭐⭐ |
| PVOUT | 2,019.2 kWh/kWp | ⭐⭐⭐⭐ |
| GHI | 2,233.3 kWh/m² | ⭐⭐⭐⭐ |
| DNI | 2,642.1 kWh/m² | ⭐⭐⭐⭐⭐ |
| DIF | 601.4 kWh/m² | — |
| D2G | 0.266 | — |
| GTI (optimal) | 2,556.3 kWh/m² | ⭐⭐⭐⭐⭐ |
| Optimal Tilt | 32° | — |
| Mean Temperature | 17.0°C | ⭐⭐⭐⭐⭐ |
| CDD | 1,111 degree-days | — |
| HDD | 1,466 degree-days | — |
| Technical Rating | High | ⭐⭐⭐⭐ |
| Initial Rank | #6 | 6️⃣ |
7. Koufra, Libya
| Indicator | Value | Rating |
|---|---|---|
| Elevation | 523 m | — |
| Slope | 3° | ⭐⭐⭐⭐ |
| Land Cover | Bare areas | ⭐⭐⭐⭐⭐ |
| Population Density | 0 hab./km² | ⭐⭐⭐⭐⭐ |
| PVOUT | 2,016.9 kWh/kWp | ⭐⭐⭐⭐ |
| GHI | 2,356.6 kWh/m² | ⭐⭐⭐⭐⭐ |
| DNI | 2,451.6 kWh/m² | ⭐⭐⭐⭐⭐ |
| DIF | 735.9 kWh/m² | — |
| D2G | 0.313 | — |
| GTI (optimal) | 2,589.4 kWh/m² | ⭐⭐⭐⭐⭐ |
| Optimal Tilt | 28° | — |
| Mean Temperature | 22.4°C | ⭐⭐⭐⭐ |
| CDD | 2,251 degree-days | — |
| HDD | 629 degree-days | — |
| Technical Rating | High | ⭐⭐⭐⭐ |
| Initial Rank | #7 | 7️⃣ |
8. Mourzouq, Libya
| Indicator | Value | Rating |
|---|---|---|
| Elevation | 879 m | — |
| Slope | 7° | ⭐⭐⭐ |
| Land Cover | Bare areas | ⭐⭐⭐⭐⭐ |
| Population Density | 0 hab./km² | ⭐⭐⭐⭐⭐ |
| PVOUT | 2,014.3 kWh/kWp | ⭐⭐⭐⭐ |
| GHI | 2,340.7 kWh/m² | ⭐⭐⭐⭐⭐ |
| DNI | 2,355.7 kWh/m² | ⭐⭐⭐⭐ |
| DIF | 766.3 kWh/m² | — |
| D2G | 0.328 | — |
| GTI (optimal) | 2,594.9 kWh/m² | ⭐⭐⭐⭐⭐ |
| Optimal Tilt | 30° | — |
| Mean Temperature | 20.4°C | ⭐⭐⭐⭐⭐ |
| CDD | 1,851 degree-days | — |
| HDD | 978 degree-days | — |
| Technical Rating | High | ⭐⭐⭐⭐ |
| Initial Rank | #8 | 8️⃣ |
Stage Two: Infrastructure and Accessibility Assessment
The first stage of our analysis identifies the locations with the strongest technical potential for large-scale photovoltaic development. However, high solar potential alone is not enough to make a site attractive for a real-world investment.
We will therefore take the top three locations from the technical ranking and subject them to a second, more practical assessment. This second phase brings in three additional indicators—factors that directly shape construction, grid connection, logistics, and long-term operation.
Proximity to power lines (High-voltage grid connection) Access to main roads (Heavy transport route) Distance to the nearest usable airport
For our initial review, we rely on Google Earth and satellite imagery to pinpoint each site and map out its distance to critical infrastructure. We pay close attention to three key lifelines: high-voltage power lines and pylons, paved roads capable of handling heavy construction and maintenance vehicles, and nearby airports that make site access straightforward for project engineers and tech teams.
Wherever we can, we also use satellite imagery to scope out the local power grid. Spotting wide transmission corridors and massive high-voltage pylons is a good early sign that a site might be near a decent connection point. That said, satellite photos only tell part of the story—they can’t confirm exact voltage, available capacity, or whether the grid can actually take on a new solar farm. Pinning down those specifics ultimately takes direct input from local grid operators or a proper on-the-ground assessment.
The same principle applies to roads and airports. Distance is only the starting point. Road quality, accessibility for heavy equipment, seasonal conditions, airport capacity, and the actual route between the site and the infrastructure can all affect the practical cost of development.
Solar Farm Site Ranking: Infrastructure & Investment Score
Each of the three new indicators will be converted into a five-star score using predefined distance thresholds. Closer proximity receives a higher score, while increasing distance progressively reduces the score.
This allows us to compare the three leading technical sites using the same methodology rather than relying solely on subjective judgment.
The objective of this second stage is therefore to answer a more practical question:
Among the technically strongest locations, which sites are also the easiest to connect, build, access, and operate?
The final ranking will combine the technical assessment with these infrastructure and accessibility indicators, giving us a more realistic picture of which Sahara location could offer the strongest overall conditions for a large-scale solar development.
Why Airport Distance Matters for Large-Scale Solar Farm Development?
First, we are studying the construction of a solar power plant in the Sahara Desert. This vast geographical area, which equals the size of major countries, has a low population density with few and small towns. For instance, we are studying two regions here, one in Algeria and the other in Egypt, and they are about 800 to 900 km away from major cities at the very least. Therefore, we integrated this indicator—the distance of the airport from the site—for the following reasons:
First, transporting sensitive and high-tech equipment:
In the control and command centers of these solar power plants, there is high-value equipment. These are usually smart and powerful computers that are very sensitive because their components consist of microchips and high-speed processors, making air transport the safest way to move them. Why is air transport the safest? Because it is the fastest and most efficient. On the other hand, land transport across thousands of kilometers from north to south—for example, from Cairo to the selected center, or from Algiers to Tamanrasset or Djanet—involves thousands of kilometers, and land transport is difficult, especially since roads sometimes are not at the level of major cities. In addition, there are climate challenges: in the summer, temperatures in these regions exceed 55°C, making this equipment vulnerable to damage.
Second, quickly moving experts and engineers to the solar plant site:
Whether during the study, construction, or even operational phases, having teams arrive quickly at the site leads to faster productivity in work—productivity in terms of the human element, efficiency, and attracting skilled talent.
Third, in case of any breakdown or shutdown of part or all of the plant:
When a failure occurs due to spare parts or technical expertise, experts, engineers, and maintenance teams must be brought in very quickly because every minute costs thousands of dollars. Having the airport close to the plant makes costs lower than if the plant were hundreds or thousands of kilometers away from the airport, which reduces costs and financial losses.
Solar Farm Investment Methodology and Site Selection Criteria
Comprehensive Assessment & Final Investment Ranking (Stage 1 + Stage 2)
| Final Rank | Location | Coordinates | Stage 1: Technical Rank Score (Max 35) | Distance to High-Voltage Grid (Max 5) | Distance to Major Road (Max 5) | Distance to Airport (Max 5) | Stage 2: Logistics Total (Max 15) | Final Total Score (Max 50) | Overall Investment Rating |
|---|---|---|---|---|---|---|---|---|---|
| 🥇 #1 | Djanet, Algeria | 24°33'17", 009°43'20" (24.554722, 9.722222) | 35 (1st Place) | 5 ⭐⭐⭐⭐⭐ (≈ 25 km) | 5 ⭐⭐⭐⭐⭐ (≈ 21 km) | 5 ⭐⭐⭐⭐⭐ (≈ 40 km - DJG) | 15 | 50 / 50 | ⭐⭐⭐⭐⭐ Prime Location |
| 🥈 #2 | Tamanrasset, Algeria | 22°51'28", 005°52'18" (22.857778, 5.871667) | 30 (3rd Place) | 4 ⭐⭐⭐⭐ (≈ 65 km) | 4 ⭐⭐⭐⭐ (≈ 65 km) | 5 ⭐⭐⭐⭐⭐ (≈ 43 km - TMR) | 13 | 43 / 50 | ⭐⭐⭐⭐ Very High Potential |
| 🥉 #3 | New Valley, Egypt | 24°24'46", 026°44'09" (24.412778, 26.735833) | 33 (2nd Place) | 3 ⭐⭐⭐ (≈ 260 km) | 3 ⭐⭐⭐ (≈ 240 km) | 3 ⭐⭐⭐ (≈ 254 km - DAK) | 9 | 42 / 50 | ⭐⭐⭐ High Potential |
Scoring Methodology Breakdown
Stage 1: Technical Rank Score (Max 35 Points)
- 1st Place (Djanet): 35 points
- 2nd Place (New Valley): 33 points
- 3rd Place (Tamanrasset): 30 points
Stage 2: Logistics & Infrastructure (Max 15 Points)
- 5 Stars / 5 Points: Distance < 50 km (Excellent proximity; minimal connection infrastructure costs)
- 4 Stars / 4 Points: Distance between 50 km – 150 km (Very good accessibility; manageable deployment costs)
- 3 Stars / 3 Points: Distance between 151 km – 300 km (Moderate accessibility; higher capital investment required)
Final Total Score (Max 50 Points)
Final Total Score = Stage 1 Technical Score + Stage 2 Logistics Total
Sahara Solar Farm Investment FAQs
Q1: Why build solar farms in the desert if it's so hot?
Deserts offer massive open space and nonstop sunshine all year round. The trick is simply picking spots in the desert that have strong sun without reaching burn-your-equipment heat.
Q2: Why on earth do you need an airport to build a solar farm?
Because these sites are deep in the middle of nowhere. An airport lets you fly in specialized engineers in hours if something breaks, and it protects delicate microchips from getting fried or shaken to bits on long, rough desert roads.
Q3: Why did Djanet in Algeria rank higher than New Valley in Egypt?
Both have amazing sunshine, but Djanet wins on location. It’s right next to existing roads, power lines, and an airport (20–40 km away), while the Egypt site is stranded over 240 km away from basic infrastructure.
Q4: Are huge desert solar projects actually doable, or are they just a pipe dream?
They’re totally doable, but only if you're realistic. Mega-projects fail when people only look at how big and sunny a desert is. They succeed when you pick smart locations close to roads and power lines.