Introduction: Electricity as the Lifeblood of the Digital Economy
Back in the late 19th century, getting Edison’s very first incandescent bulb to glow felt like pure magic. Honestly, nobody back then could have ever pictured that this exact same electrical current would turn into the world's invisible engine—the driving force behind AI and the absolute heartbeat of the global digital economy. Over the decades, power grids just quietly evolved from simple setups meant to light up city streets and run early factory floors into this massive, mission-critical backbone keeping the modern digital world ticking.
Fast forward to today, with artificial intelligence, cloud computing, and IoT woven into every single part of our day-to-day lives, and electricity has basically become the most vital strategic asset on the planet. We aren't just relying on it for home appliances or heavy manufacturing anymore; it's baked into literally every single second of our routine. From smartphones and smart gadgets to EVs, cloud servers, and everyday AI prompts, everything runs on an uninterrupted, constant stream of power.
This massive shift has totally flipped how the financial world operates, too. Physical ledgers and cash are mostly old news, replaced by digital banking, instant apps, and crypto networks like Bitcoin, Ethereum, and a ton of other digital assets. But keeping millions of servers humming 24/7, pushing instant payments through, and verifying blockchain transactions via continuous mining takes an astronomical, non-negotiable amount of electricity around the clock.
And as AI models scale like crazy and data centers pop up everywhere, electricity demand is breaking records with no signs of slowing down, pushing power grids right up to their absolute limits. Governments everywhere are sweating over a super delicate balancing act: trying to feed this insatiable hunger for energy while keeping environmental goals and sustainability in check. It's stressing out world leaders big time—especially across the European Union as they race toward those strict 2030 carbon targets.
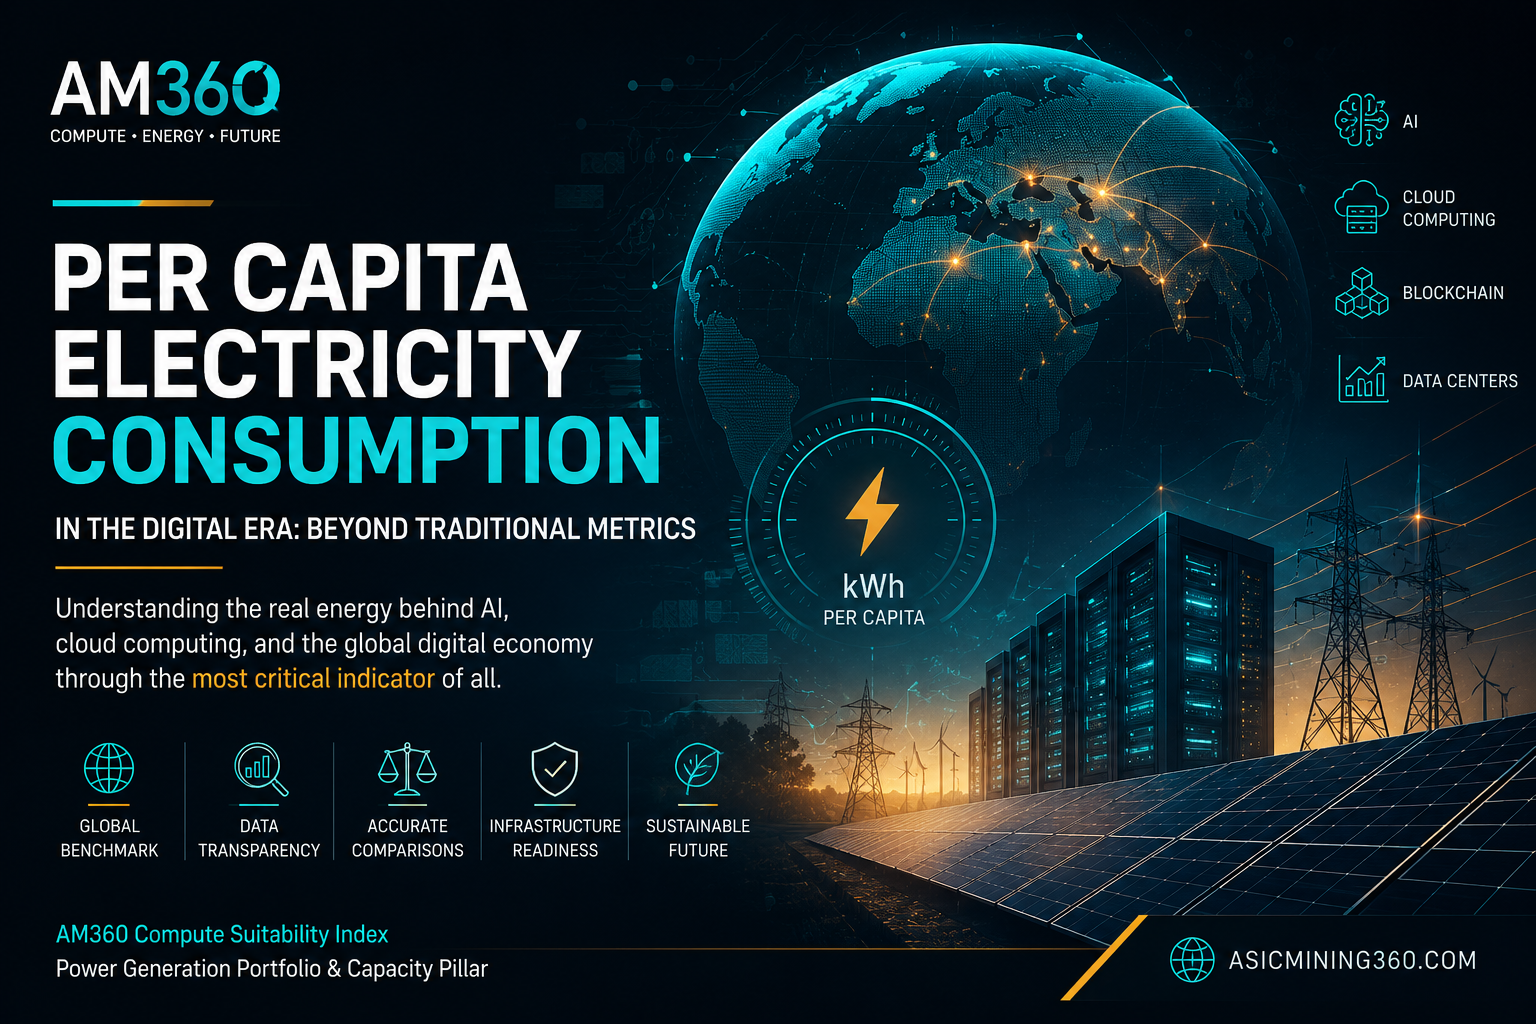
Because things are shifting so fast, tracking energy data isn't just about skimming through boring, dry spreadsheets anymore; it's honestly one of the best indicators of whether a country is actually ready for a compute-driven future. Right at the center of this conversation is Electric Power Consumption (kWh per capita) as a core benchmark. In this piece, we’re going to break down how this metric is actually calculated, look closely at where the data comes from, figure out why traditional stats often miss the real picture, and check out its heavy-hitting role inside the Power Generation Portfolio & Capacity pillar of the AM360 Compute Suitability Index—the proprietary framework our platform uses to grade national infrastructure readiness.
Defining the Core Indicator
Electric power consumption (kWh per capita) is one of the most widely recognized economic and development benchmarks globally, standardized and published by institutions like the World Bank and the International Energy Agency (IEA).
1. Definition
This metric measures the net amount of electricity actually consumed within a country, expressed as an annual average per person in kilowatt-hours (kWh).
Look, let's keep it real: at the end of the day, this indicator isn't about total power generation—it's strictly about net consumption. Basically, it cuts through all the noise to look at the actual electricity that makes it down the line to homes, factories, data centers, and public utilities, after taking out the power lost on transmission lines and cross-border grid transfers.
2. Step-by-Step Calculation
The calculation process follows two main stages:
Stage 1: Net National Electricity Consumption
National generation data is compiled and adjusted using the following accounting model, subtracting key operational deductions:
-
Station Own Use: Electricity consumed directly by power plants to operate their own turbines, cooling towers, and internal facilities.
-
Transmission & Distribution Losses (T&D Losses): Electrical energy dissipated as ambient heat across power lines, towers, and transformers.
-
Net International Trade: Subtracting electricity exported to neighboring grids and adding imported power.
Stage 2: Per Capita Division
Once the net national electricity consumption is established, the total figure is divided by the country's midyear population:
Per Capita Consumption = Net National Electricity Consumption / Midyear Population
3. What the Metric Covers (And What It Misses)
-
What it covers: Electricity generated across all primary fuel sources—coal, natural gas, oil, nuclear, hydro, solar, and wind—that ultimately reached end users.
-
What it misses: Blackout frequencies, grid efficiency, or service reliability. Furthermore, it does not distinguish between the electricity consumed by a citizen in their home versus the power consumed by massive industrial facilities or foreign-facing data centers operating within that same country.
Cross-Border Electricity Use in the Age of Artificial Intelligence
In past decades, per capita electricity consumption was treated as a strictly local indicator, directly tied to the country where the end-user resided. Today, with the rapid spread of cloud computing, AI processing, and cloud mining—where users lease remote hash rate to mine cryptocurrencies—a growing portion of energy consumption occurs far beyond the borders of the end-user’s country.
When an individual or business in Egypt, India, or anywhere else runs an AI query, accesses cloud storage, or deploys cloud mining rigs, the actual processing work does not take place on their local hardware. Instead, it executes inside massive data centers located in the United States, Iceland, or other hosting nations. As a result, the electricity consumed is logged under the hosting nation’s energy tally rather than the user's home country.
This means millions of daily users contribute significantly to electricity consumption in foreign countries without leaving a trace in their own national statistics. As AI integration accelerates, this cross-border displacement will grow more pronounced, rendering traditional per capita energy metrics increasingly incomplete when trying to reflect the actual electrical footprint of the modern digital economy.
Consequently, there is a growing need for complementary, forward-looking indicators that track cross-border energy footprints—evaluating energy not merely where it is generated or physically consumed, but where the actual digital utility is being extracted.
The Scale of Digital Power: Data Centers vs. Entire Nations
To really wrap your head around how massive this shift is, you just have to look at the jaw-dropping amounts of power keeping modern tech afloat. The IEA estimates that data centers worldwide—along with all the heavy lifting behind artificial intelligence—gulped down roughly 415 terawatt-hours (TWh) of electricity in 2024. To put that into perspective, that single digital footprint is bigger than the yearly power consumption of Spain, Portugal, Algeria, and Morocco put together.
Think about that for a second. We're talking about four countries home to over 140 million people, using electricity to run literally every corner of their societies—from Algeria's heavy mining and oil-and-gas sectors and Morocco’s bustling farming and tourism, to heavy-duty manufacturing in Spain and Portugal. It keeps the lights on in their homes, powers their hospitals and schools, runs their transit systems, and drives all the cooling needed across the board. Yet, data centers alone use even more than all of that combined.
Looking ahead, IEA projections indicate that by 2030, global data center electricity consumption could surge past 950 TWh annually, heavily propelled by the relentless expansion of AI and cloud computing. This volume equals or exceeds the total combined electricity consumption of Spain, Portugal, Algeria, Morocco, Egypt, Poland, and the Netherlands—a group of nations with a combined population exceeding 303 million people. Meeting this projected surge will demand unprecedented fossil fuel resources and massive land allocations for utility-scale solar farms.
The Strategic Value of Energy Metrics
Energy metrics have become essential instruments for researchers, investors, and policymakers striving to evaluate current energy landscapes, track structural economic shifts, and gauge a country's readiness for next-generation technology.
Within this framework, Electric Power Consumption (kWh per capita) serves as a vital diagnostic tool. It acts as a primary sub-indicator for evaluating the Power Generation Portfolio & Capacity axis within the AM360 Compute Suitability Index.
The Measurement Dilemma: Gross Generation vs. Actual Consumption
When you start digging into per capita energy stats, you'll notice that different databases and institutions don't always match up. A lot of that comes down to two totally different ways of doing the math:
-
Production-Based Calculations: If you just take a country's total power generation (Gross Generation) and divide it by the population, you're going to get numbers that look pretty different from what the World Bank publishes. That's because this approach assumes every single kilowatt generated stays right there at home for domestic use, which isn't how the real world works.
-
Consumption-Based Calculations: On the flip side, methods like the ones the World Bank uses focus purely on what end-users actually consume. When you compare the two, the gaps can easily add up to hundreds—or even thousands—of kilowatt-hours per person.
-
Root Causes of Discrepancies: Why do these gaps happen? It all boils down to everyday operational realities: importing and exporting power across borders, energy lost as heat on transmission lines, the electricity power plants use to run their own operations, and varying data standards between agencies. At the end of the day, these differences aren't calculation mistakes—they're just two different ways of looking at the data.
Metric Limitations in the Modern Digital Economy
To be fair, even though this metric has been a go-to economic benchmark for ages, it's losing its grip on reality as the digital world shifts. The big issue is how much we all rely on data centers and tech infrastructure sitting in completely different countries.
Take a real-world example: if you're sitting in Egypt or Algeria running an AI model or pulling data from the cloud, the heavy lifting isn't happening down the street—it's executing in massive data centers over in Europe or the States.
The bottom line? All that heavy power draw gets lumped right into the host country's energy stats, completely missing the user actually driving the demand. Traditional metrics just can't keep up with how borderless the modern digital economy has become on their own.
Global Rankings: Top 10 Countries in Per Capita Electricity Consumption
Based on the latest institutional datasets, the table below highlights the top 10 countries in per capita electricity consumption, along with the primary energy-consuming sector driving each nation's footprint:
| Rank | Country | Survey Year | Per Capita Electricity Consumption (kWh) | Dominant Energy-Consuming Sector |
|---|---|---|---|---|
| 1 | Iceland | 2024 | 48,998 | Heavy industry (aluminum smelting) and cryptocurrency mining |
| 2 | Norway | 2024 | 23,673 | Energy-intensive industries and space heating in cold climates |
| 3 | Bahrain | 2023 | 23,120 | Air conditioning, water desalination, and aluminum smelting |
| 4 | Qatar | 2023 | 19,963 | Water desalination, HVAC cooling, and petrochemical industries |
| 5 | Kuwait | 2023 | 16,496 | Air conditioning, water desalination, and public infrastructure |
| 6 | United Arab Emirates | 2023 | 15,285 | Air conditioning, water desalination, and logistics/services hubs |
| 7 | Finland | 2024 | 14,819 | Pulp and paper industries, plus residential heating in cold climates |
| 8 | Canada | 2024 | 14,093 | Extractive resource industries, space heating, and transport |
| 9 | United States | 2024 | 12,839 | Commercial/residential HVAC building systems and data centers |
| 10 | Sweden | 2024 | 12,226 | Heating, heavy industry (steel and paper), and transport |
(Note: Based on these figures, Saudi Arabia ranks 11th globally at 11,911 kWh for 2023, followed by Luxembourg in 12th place at 11,662 kWh for 2024).
Conclusion
Look, let’s be honest: tracking kilowatt-hours per person gives us a nice baseline to look at a country's energy grid, but it just doesn’t cut it anymore on its own. Between the digital boom, massive AI workloads, and data centers pulling power across borders, looking at old-school metrics by themselves is like trying to navigate a modern city with a paper map from 1990. We’ve got to pair these traditional numbers with modern frameworks—like the AM360 Compute Suitability Index—if we actually want to understand where global computing is heading and make sense of the real digital footprint out there.