
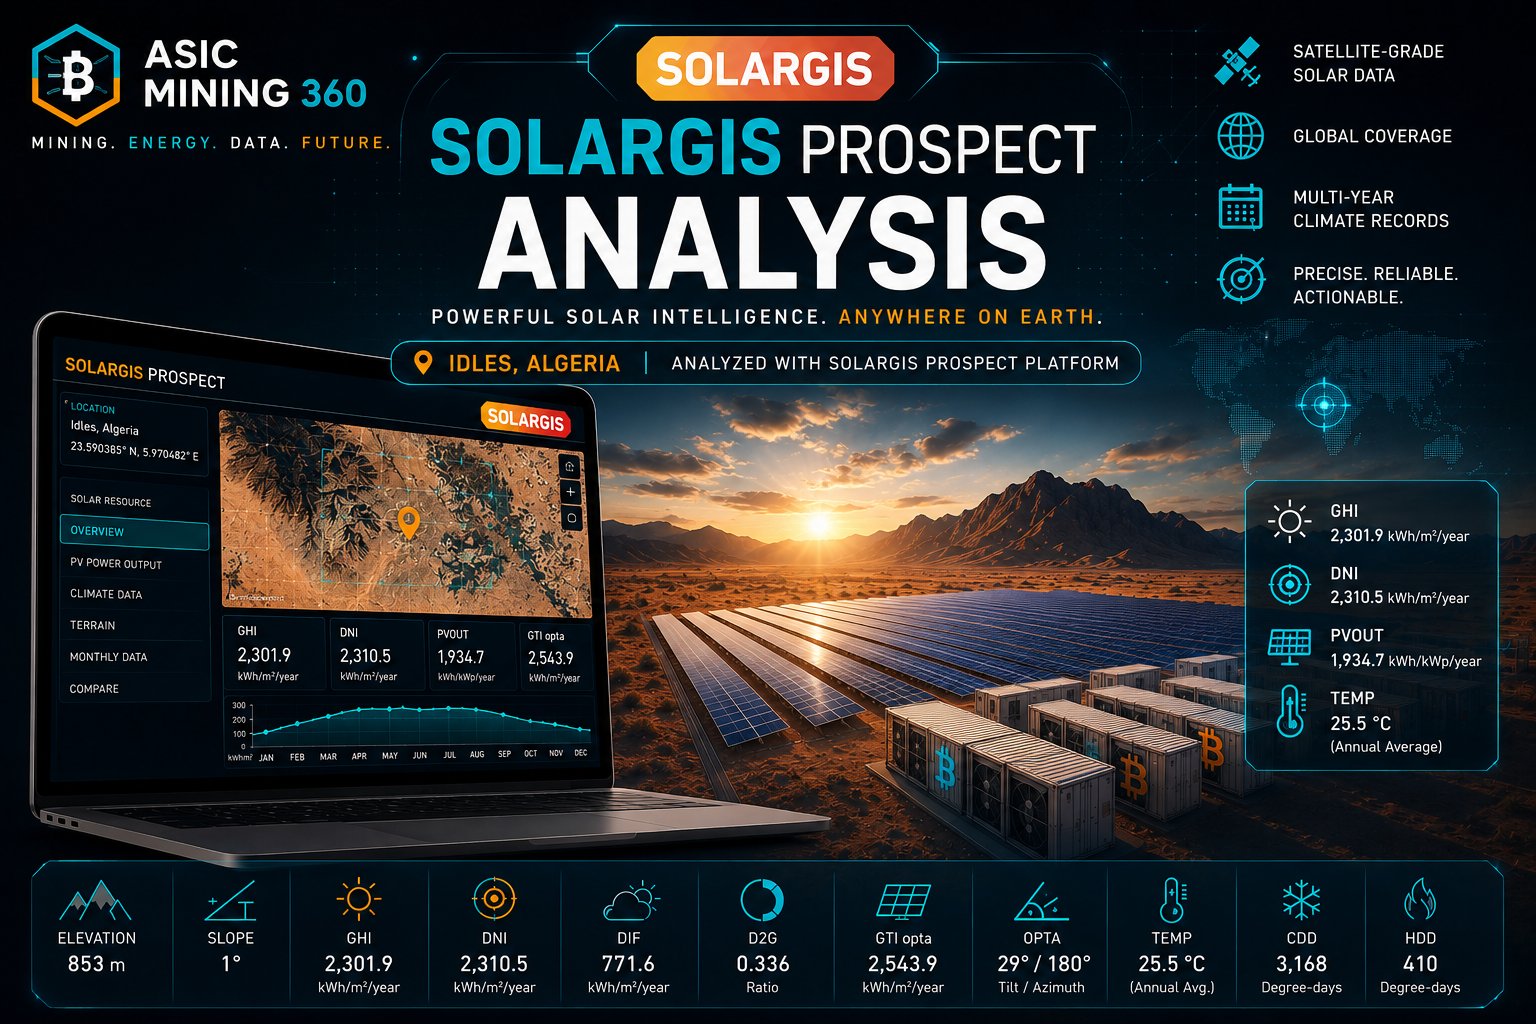
Introduction: What Is Solargis Prospect? Interactive Solar Resource Mapping Explained
At ASIC Mining 360, we get it—between regional tensions and what's happening around the Strait of Hormuz, energy prices are out of control. The supply squeeze is real, and it’s hurting everyone's bottom line.
When electricity prices bounce around like this, it hits mining operations right where it hurts. Power is our biggest expense, period. That’s why so many operators are giving up on the grid and looking seriously at solar to take control of their energy supply.
How to Use Solargis Prospect for Solar Energy Project Planning
If you're looking into solar, Solargis Prospect is a tool worth checking out. It gives you solid, up-to-date data based on years of continuous satellite tracking—so you're not relying on guesses.
It’s built by Solargis s.r.o., a team out of Slovakia that’s been focused on solar data since 2010. Their interactive map uses multi-year climate records, giving you a realistic picture of solar potential without getting misled by short-term weather anomalies.
You can jump anywhere on the global map to check the raw solar potential of a prospective site. It breaks down all the core metrics you actually need—like GHI, DNI, DIF, and GTI irradiance—plus estimated PV power output (PVOUT) and localized climate data to give you the full picture.
Understanding Solargis Prospect Metrics: GHI, DNI, PV Output & Solar Irradiance
Figure 1. Study Location in Solargis Prospect (Idles, Tamanrasset, Algeria – 23.590385° N, 5.970482° E)
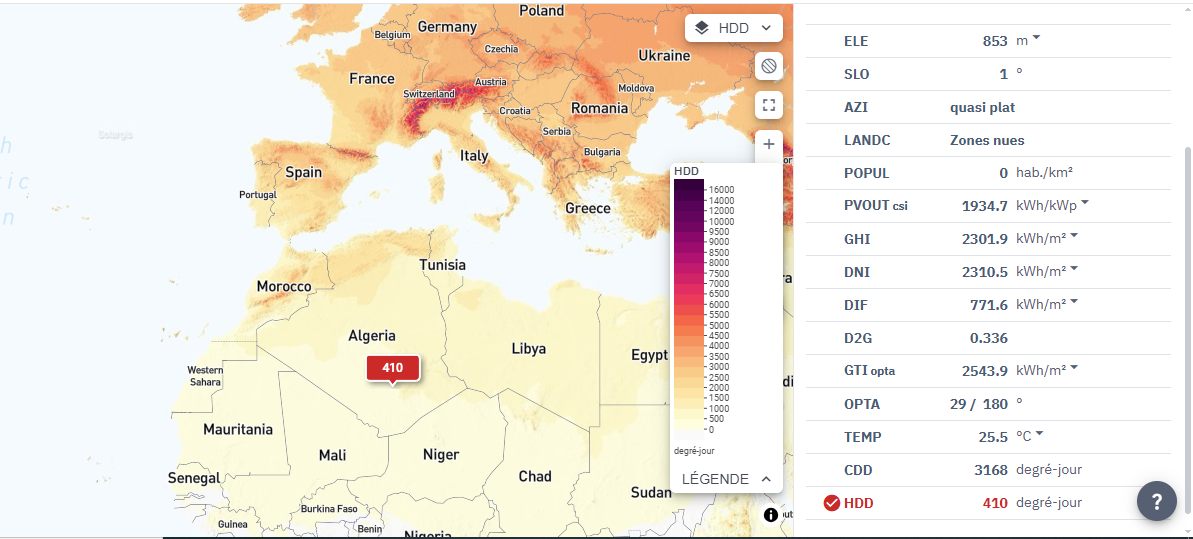
| Parameter | Value | Unit | What It Means | Why It Matters for Solar & Mining |
|---|---|---|---|---|
| ELE (Elevation) | 853 | m | Height above sea level. | Elevation influences atmospheric conditions and operating temperatures, both of which can affect photovoltaic performance. |
| SLO (Slope) | 1 | ° | Average terrain slope. | A nearly flat site simplifies construction, reduces earthwork requirements, and is ideal for utility-scale solar installations. |
| AZI (Terrain Azimuth) | Nearly Flat | — | Natural orientation of the terrain. | Since the terrain is essentially flat, its natural orientation has little impact on system design, allowing panels to be positioned at their optimal azimuth. |
| LANDC (Land Cover) | Bare Land | — | Surface classification of the area. | Bare land is generally ideal for large-scale photovoltaic projects because of minimal vegetation and shading. |
| POPUL (Population Density) | 0 | inhabitants/km² | Population density around the site. | Extremely low population density suggests abundant land availability with minimal development constraints. |
| PVOUT (CSI) | 1,934.7 | kWh/kWp/year | Estimated annual electricity production from a 1 kWp photovoltaic system under long-term average conditions. | A key indicator for estimating annual energy generation and project profitability. |
| GHI (Global Horizontal Irradiance) | 2,301.9 | kWh/m²/year | Total solar radiation received on a horizontal surface. | One of the primary indicators used to evaluate the solar potential of a location. |
| DNI (Direct Normal Irradiance) | 2,310.5 | kWh/m²/year | Direct solar radiation received on a surface always facing the sun. | Particularly important for concentrated solar power systems and useful for assessing direct sunlight availability. |
| DIF (Diffuse Horizontal Irradiance) | 771.6 | kWh/m²/year | Solar radiation scattered by the atmosphere before reaching the surface. | Indicates the contribution of diffuse sunlight to the site's total solar resource. |
| D2G (Diffuse-to-Global Ratio) | 0.336 | Ratio | The proportion of diffuse radiation relative to total global radiation. | A moderate value indicates that direct sunlight still dominates, although atmospheric scattering is slightly higher than at very clear desert locations. |
| GTI (Optimal Tilt Irradiance) | 2,543.9 | kWh/m²/year | Solar irradiation received on a photovoltaic panel installed at its optimal tilt and orientation. | Represents the solar energy available to a properly optimized PV system. |
| OPTA (Optimal Tilt / Azimuth) | 29° / 180° | Degrees | Recommended panel tilt angle and orientation. | Installing panels close to these values maximizes annual electricity production. |
| TEMP (Average Air Temperature) | 25.5 | °C | Long-term annual average ambient temperature. | Higher temperatures may slightly reduce photovoltaic efficiency and increase cooling requirements for electrical equipment. |
| CDD (Cooling Degree Days) | 3,168 | Degree-days | Annual indicator of cooling demand based on outdoor temperatures. | High CDD values suggest significant cooling requirements for mining facilities, data centers, and inverter stations. |
| HDD (Heating Degree Days) | 410 | Degree-days | Annual indicator of heating demand based on outdoor temperatures. | Low HDD values indicate that heating requirements are minimal throughout most of the year. |
Solargis Prospect Insights: Identifying the Best Locations for Solar Projects
The Solargis assessment reveals far more than a collection of solar metrics. Together, these indicators provide valuable insights into the site's suitability for photovoltaic development and energy-intensive applications such as cryptocurrency mining and AI data centers.
1. Reliable Data for Even the Most Remote Locations
What’s really impressive here is the location itself: Idles, in Tamanrasset, right in the heart of the Algerian Sahara. It’s over 1,900 km from Algiers by road, sitting way out past the main power grid and infrastructure. Yet, Solargis still pulls full, long-term solar assessments using satellite data—proving you can get pinpoint data pretty much anywhere on Earth.
2. A World-Class Solar Resource
The numbers here are massive: site data shows a Global Horizontal Irradiance (GHI) of 2,301.9 kWh/m²/year and a Direct Normal Irradiance (DNI) of 2,310.5 kWh/m²/year. That puts this site squarely in the top tier of global solar assets—making it an ideal hub for utility-scale solar builds or dedicated, off-grid industrial power.
3. Clear Desert Skies with High Direct Sunlight
A D2G ratio of 0.281 shows that diffuse radiation makes up only a fraction of the sunlight here—the vast majority hits the ground as direct light. That's classic clear desert weather with barely any cloud cover, meaning solar setups get extremely steady, dependable sunlight year-round.
4. Outstanding Photovoltaic Energy Yield
An estimated PVOUT of 1,934.7 kWh/kWp/year means every single kilowatt of solar capacity you install pumps out nearly 2 MWh of power a year. That's top-tier efficiency, giving operators a rock-solid foundation for driving down energy costs with cheap renewables.
5. Highly Favorable Site Characteristics
The ground conditions make this site even better for a major buildout. You’re looking at a gentle 1° slope, wide-open Bare Land, and practically zero local population density. That means no land-use headaches, minimal shading issues, and a much simpler path to setting up a massive solar array.
6. High Elevation with a Moderate Annual Climate
Even though it's in the middle of the Sahara, the site sits 853 meters up, keeping the average annual temperature around 25.5°C. That altitude advantage is huge—cooler operating temperatures mean less thermal loss and better PV efficiency than you’d ever get down in the low-desert heat.
7. Optimized Panel Orientation
Solargis provided precise and strict recommendations to make precise and very good use of the area. Those recommendations consisted of fixing the panels at a specific tilt angle, which is 28 degrees Celsius, and directing them towards true south (180 degrees) to absorb the largest possible amount of solar radiation throughout the year, meaning in all seasons: summer, spring, autumn, winter. Complying with this recommended precise angle results in avoiding loss or waste in sunlight absorption efficiency, which results in stability in production.
Bottom Line:
What makes Idles exceptional isn't just the high solar radiation and peak PV yields—it's the complete atmospheric clarity. Because the area is isolated from major urban pollution and smog, solar penetration stays at its maximum year-round. Combined with vast, unencumbered land for future expansion, you have a premier energy footprint built for scale. These conditions make the site well suited for utility-scale solar farms capable of supplying reliable renewable electricity to AI compute centers, data centers, and cryptocurrency mining operations.
Key Features of Solargis Prospect: Interactive Maps, Solar Layers & Analytics
General Layers
As a completely free service, the platform delivers a rich set of geographic mapping layers powered by satellite imagery (sourced from advanced earth-observation satellites). These layers help experts, prospective investors, and energy pioneers truly understand the distinct physical terrain of the targeted plot before diving into its solar potential. By showcasing detailed topographies, altitude variations, ground slopes, terrain orientation (azimuth), land cover classes, population density, and anticipated photovoltaic energy yield (PVOUT), this aggregated data provides invaluable spatial context to evaluate whether this specific location perfectly matches the requirements for utility-scale solar development.
Solar Resource Layers
Beyond these initial metrics, the platform opens up a broad catalog of specialized solar maps derived from years of continuous satellite earth-observation. This gives developers, academic researchers, and prospective investors the ability to evaluate vital irradiance parameters—such as Global Horizontal (GHI), Direct Normal (DNI), Diffuse (DIF), and Global Tilted Irradiance (GTI), which we highlighted in the preceding matrix.
On top of that, the tool pinpoints the ideal tilt orientation required to extract maximum yield from every panel.In practice, these datasets feed straight into your financial models, helping you forecast returns and evaluate candidate locations side by side with confidence. And if you need to account for long-term weather risks, the paid tiers step in with multi-year trend mapping and seasonal breakdown tools.
Climate Layers
Solar radiation is only half the story—local weather plays a huge role in how panels actually perform on the ground. The base platform covers ambient air temperature, but stepping up to the premium tiers opens up critical operational data: panel-level temperatures, humidity, wind patterns, rainfall, hail risks, and snowfall. Having these weather metrics on hand lets engineering teams stress-test their designs and build far more reliable yield predictions
Environmental Layers
Choosing the right hardware comes down to how well it holds up against local environment conditions. Solargis supplies targeted environmental data—ranging from surface albedo and actual cell operating temperatures to optical GTI losses, atmospheric moisture, UV exposure (UVA/UVB), and corrosion rates. Having these insights early on allows technical teams to pick the right panel tech and hardware durability ratings tailored for harsh desert climates.
Why Solargis Prospect Is a Powerful Tool for Solar Resource Assessment
At the end of the day, high-yield solar development takes more than just sun charts. Solargis Prospect pulls geography, weather risks, environmental stressors, and real-world panel mechanics into one cohesive engine. This gives developers and investors a complete, multi-angle picture of site viability long before writing the first check or locking in technical specs.
Official Solargis Prospect Resources & Further Reading
This analysis was prepared using publicly available data and visualization tools provided by Solargis Prospect.
To explore solar resource assessments, interactive maps, and photovoltaic performance estimates, visit the official Solargis Prospect platform: